Relationship Between Systemic Thrombogenic or Thrombolytic Indices and Acute Increase of Spontaneous Intracerebral Hemorrhage
Article information

Abstract
Objective
The objective of this study was to determine the correlations between changes in thrombogenesis or thrombolysis related factors, and the acute increase of a spontaneous intracerebral hemorrhage (sICH).
Materials and Methods
From January 2009 to October 2011, 225 patients with sICH were admitted to our hospital within 24 hours of onset. Among them, 111 patients with hypertensive sICH were enrolled in this study. Thrombogenic or thrombolytic factors were checked at admission. The authors checked computed tomography (CT) scans at admission and followed up the next day (between 12-24 hours) or at any time when neurologic signs were aggravated. Cases in which the hematoma was enlarged more than 33% were defined as Group A and the others were defined as Group B.
Results
Group A included 30 patients (27%) and group B included 81 patients (73%). Factors including activated partial thromboplastin time, prothrombin time, fibrinogen, and D-dimer showed a greater increase in group A than in group B. Factors including antithrombin III, factor V, and factor X showed a greater increase in group A than in group B.
Conclusion
Based on the results of this study, it seems that the risk of increase in hematoma size can be predicted by serum thrombogenic or thrombolytic factors at admission.
INTRODUCTION
Spontaneous intracerebral hemorrhage (sICH) is a disorder accounting for 10%~15% of all strokes and has high rates of morbidity and mortality.2)3)5)8)19) When the size of a hematoma increases, neurological aggravation can frequently be observed during the early stage of sICH.8)19)21)32) Age, status of consciousness, volume of hematoma, blood pressure, and midline shift on brain computerized tomography (CT) scanning are factors that influence the prognosis of sICH.7)10)15)19)23)24)29)30)31) There have been clinical situations in which a patient with a small hematoma and minor neurological deficiencies at the initial stage showed aggravation of neurological deficiencies with enlargement of the hematoma during conservative treatment. Thus, even if the initial status of the sICH is not so severe, careful monitoring is still required; and ability to predict increased size of the hematoma would be very helpful during initial treatment. Several articles investigating the correlation between the prognosis of spontaneous intracerebral hemorrhage and coagulation factors have been published.5)8)11)19)27) However, no notable research analyzing thrombogenesis or thrombolysis related factors in forecasting increases in hematoma size at the initial stage of sICH has been reported. The purpose of this study was to determine the correlations between changes in thrombogenesis or thrombolysis related factors and acute increases in hematoma size in patients with sICH.
MATERIALS AND METHODS
Patients
Among 225 patients with sICH diagnosed within 24 hours after symptom onset who were admitted from January 2009 to October 2011, only 111 patients were enrolled in this study. Patients with hemorrhage due to arteriovenous malformation, moyamoya disease, brain tumors, or hemorrhagic infarction were excluded. Patients who underwent emergency operations, took antiplatelet agents, or suffered from blood coagulation disorder, thrombocytopenia, chronic liver diseases, or chronic alcoholism were also excluded from this study.
Methods
Age, sex, Glasgow coma scale (GCS) score, thrombogenesis or thrombolysis related factors, brain CT and recovery scale at the time of discharge from the hospital (Glasgow outcome scale, GOS) were investigated for all patients. GOS scores including good recovery (GOS = 5) and moderate disability (GOS = 4) were categorized as good outcomes, while severe disability (GOS = 3), persistent vegetative state (GOS = 2), and death (GOS = 1) were categorized as poor outcomes. A brain CT scan was performed during the patients' hospital visit and follow-up scanning was performed within 24 hours. When signs of neurological exacerbation were observed, CT scanning was performed immediately. The time between the manifestation of symptoms, the first CT, and the follow-up CT was examined. The size of the hematoma was measured by (a × b × c) × 0.5 method.14)18) The 'a' and 'b' refer to the diameters of the hematoma with the largest area while 'c' refers to the thickness. A volume increase of more than 33% from the initially measured volume of the hematoma was defined as an increase in the size of the hematoma. An increase in the size of the hematoma of 33% was considered a clinically significant minimum increase.4) The group with an increase of more than 33% in the size of their initial hematomas was designated as group A, and the others were designated as group B. Thrombogenesis or thrombolysis related factor tests were performed by drawing venous blood at the time of the patients' appearance at the hospital. Test items and the normal hospital range included 12-44 seconds for activated partial thromboplastin time (aPTT); 12-14 seconds for prothrombin time (PT); 200-450 mg/dl for fibrinogen; 75-150% for plasminogen; 70-125% for antithrombin III (AT III); less than 10 µg/ml for fibrin/fibrinogen degradation product (FDP); less than 0.5 µg/dl for D-dimer; 70-130% for protein-C activity; 66-126% for factor V; 60-150% for factor VIII; and 70-120% for factor X. Finally, correlations between changes in each of the factors - age, sex, GOS, volume of hematoma, and whether or not the size of hematoma increased - were analyzed. Because blood pressure is the single most important factor in determining rapid expansion of an ICH, blood pressure was measured every 15 minutes in the early stage with the goal of keeping systolic blood pressure of ICH patients below 160 mm Hg. Patients were treated with sodium nitroprusside in order to decrease systolic blood pressure.
A Chi-square test and student t-test were performed for statistical analysis. A p value of < 0.05 was considered statistically significant.
RESULTS
Of the 111 subjects, group A included 30 subjects and group B included 81 subjects. The mean age of subjects in group A was 59.8 ± 14.1 and that of subjects in group B was 58.4 ± 14.3 years old, thereby showing no statistical difference (p = 0.799). There were no differences in sex distribution of 21 males and nine females in group A, and 54 males and 27 females in group B (p = 0.445). The mean time spent for the first CT from the manifestation of symptoms was 6.7 ± 3.4 hours for group A and 6.9 ± 4.8 hours for group B, thereby showing no difference (p = 0.337), and the interval between CT scanning was 16.6 ± 2.8 hours for group A and 16.5 ± 3.2 hours for group B, showing no difference (p = 0.354). The mean GCS score was 11.2 ± 3.5 for group A and 11.6 ± 2.8 for group B, thereby showing no difference between the two groups (p = 0.705). In group A, there were 12 cases of good prognosis (40%) and 18 cases of poor prognosis (60%), while 57 cases of good prognosis (70.4%) and 24 cases of poor prognosis (29.6%) were found in group B. Group A showed more statistically significant adverse prognosis for increase in hematoma compared with group B (p = 0.024). The size of the initial intracerebral hematoma was 24.9 ± 15.5 cc in group A and 23.1 ± 15.8 cc in group B, thereby showing no statistical difference between the two groups (p = 0.766). The size of hematomas under rescanned CT was 35.2 ± 14.1cc for group A and 25.7 ± 15.7 cc for group B with a statistical difference of p = 0.018 (Table 1).
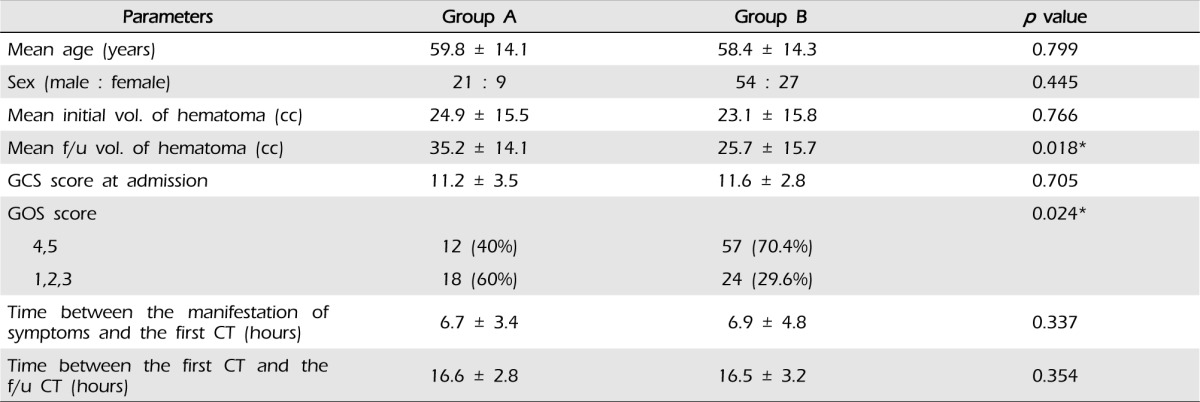
Demographic and clinical parameters (Chi-square test, student t-test)
Factors including activated partial thromboplastin time (aPTT), prothrombin time (PT), fibrinogen, D-dimer, fibrin-fibrinogen degradation product (FDP), antithrombin III (AT III), factor V, and factor X caused statistically significant differences between the two groups (Table 2). Factors including aPTT (A: 33.6 ± 7.5sec, B: 27.7 ± 2.7sec, p = 0.030), PT (A: 13.7 ± 4.2 sec, B: 12.0 ± 0.7sec, p = 0.014), fibrinogen (A: 541.8 ± 245.7 mg/dl, B: 390.4 ± 108.1 mg/dl, p = 0.013), and D-dimer (A: 1.4 ± 0.9 µg/dl, B: 0.6 ± 0.5 µg/dl, p = 0.005) showed a greater increase in group A than in group B. Twenty four subjects in group A (80%) showed abnormal increases in FDP compared to 45 subjects in group B (56%), a significantly higher rate in group A (p = 0.001).

Differences in thrombogenesis or thrombolysis related factors between group A and B (Chi-square test, student t-test)
Factors including AT III (A: 73.6 ± 20.3%, B: 88.3 ± 18.1%, p = 0.041), factor V (A: 83.9 ± 16.2%, B: 105.7 ± 25.4%, p = 0.017), and factor X (A: 81.0 ± 29.7%, B: 108.1 ± 17.9%, p = 0.002) showed a greater decrease in group A than in group B.
Plasminogen (A: 102.2 ± 24.1%, B: 105.5 ± 20.2%, p = 0.674), protein C (A: 91.4 ± 27.5%, B: 104.7 ± 27.1%, p = 0.193), and factor VIII (A: 164.2 ± 77.9%, B: 173.6 ± 67.4%, p = 0.719) tended to decrease more in Group A than in Group B, however, this decrease was not statistically significant (Table 2).
DISCUSSION
Approximately 14%~38% of patients with sICH showed an increase in the size of their hematomas within 24 hours.4)9)13) In this study, a volume increase of more than 33%, i.e. an increase of 10% in diameter was defined as significant. This increase is clearly visible on brain CT. In addition, since the quantity can be measured differently depending on the posture of the patient or angle of scanning of CT regardless of the actual increase in size, 33% is a clinically significant increase.4) In this study, 30 cases (27%) showed an increase in size of the hematoma of more than 33%.
A short delay between the symptoms of the disorder and a visit to the hospital, heavy drinking, irregular shape of the hematoma, and a poor level of consciousness are known to cause increases in the size of hematomas.13) In this study, chronic alcohol addiction was excluded in order to determine the association between thrombogenesis or thrombolysis related factors. No difference in the time of CT scanning and the intervals was observed between the symptoms of the two groups, therefore, it was determined that there is no bias for disclosing the association between thrombogenesis or thrombolysis related factors and initial increase in the hematoma.
Studies for determining brain injuries in which the relationship between D-dimer and blood coagulation factors was investigated have been reported.8)17) D-dimer is an index that measures activation of blood coagulation in the entire body along with the active occurrence of fibrinolysis.8) The value of D-dimer is higher in patients with intracerebral hemorrhage than in healthy people.8)11) If the D-dimer has increased and then a fibrinolytic process occurs excessively after formation of a blood clot, this may cause an increase in the size of the hematoma.6)8)26) In this study, both groups showed an increase in D-dimer; however, it showed a greater increase in group A than in group B. This can lead to recurrence of hemorrhages due to excessive fibrinolytic action.
FDP is a substance generated through disintegration of fibrin or fibrinogen by plasmin in the process of fibrinolysis, which includes D-dimer. An increase in FDP indicates the process of active fibrinolysis, which results in an increase in the size of the intracerebral hematoma, as in the case of increased D-dimer. In this study, the authors verified the relationship between the group with increased FDP and the group with increases in hematoma size.
Fibrinogen increases in the acute inflammatory phase, which is known as an indicator of the extent of brain tissue damage and the prognosis of ischemic infarctions.20)24) In this study, it was found that the value of fibrinogen was related to the increased size of the hematoma. This value showed a more significant increase in group A than in group B. Although the fibrinogen value is not directly involved in the thrombogenic or thrombolytic process, it can be seen that the acute inflammatory reaction and brain damage around the hematoma is greater in group A with a higher value than in group B. In this case, the possibility of an increase in hematoma size can be higher.
Activation of hemostatic action in strokes has not been definitively observed. One report assumes that activation of the overall hemostatic process begins by release of a blood clot into the blood, and, according to a contrasting report, it is induced from a localized excessive coagulation state in the damaged brain tissues and surrounding blood vessels.11)12) In the majority of brain damaged patients, the role of the tissue factor (coagulation factor III) is important.28) The value of tissue factors of cerebrospinal fluid in a subarachnoid hemorrhage patient is five times greater than in a normal person, signifying that the tissue factor is released when brain tissue is damaged.16) Research studies on the increase in activation of tissue factors in a damaged brain compared to a non-damaged brain have been published.1)22)
The tissue factor exists in the form of protein under the vascular epithelial tissues and the extrinsic pathway begins when the tissue factor is discharged from the damaged tissues. The discharged tissue factor activates factor VII and combines with factor VIIa to create tissue factor-VIIa (TF-VIIa) complex. TF-VIIa complex activates factor VII and factor X, which activates the blood coagulation system in which thrombin is generated from prothrombin. However, excessive activation of the blood coagulation process can induce a blood coagulation disorder due to excessive consumption of blood coagulation factor, and, in severe cases, induces disseminated intravascular coagulation (DIC) disorder. This activation of tissue factors affects the blood coagulation disorder by inducing changes in blood coagulation factors.22)
Factor X is involved in intrinsic and extrinsic pathways, and factor V acts as a cofactor. In this study, factor V and factor X were reduced in group A. It appeared that factor V and factor X were reduced due to induction of a localized wasting blood coagulation disorder from the excessive coagulation state induced by intracerebral hemorrhage in group A. Thus, the size of the hematoma increased due to failure to carry out appropriate coagulation. On the other hand, it appeared that in group B there was a sufficient quantity of each of the factors, thereby preventing wasting blood coagulation disorder during the coagulation pathway, and the blood coagulation process took place as usual.
Blood coagulation activating factors are released from the microvascular structure of the brain within six hours of severe brain damage and these are limited by AT III.25) Thus, AT III acts as an inhibitory factor in the blood coagulation pathway. In this study, AT III was lower in group A. It was found that if AT III is lower, the reason for further increase in the size of hematoma, even though the blood coagulation route should be further activated, is that other factors as well as AT III were consumed due to localized wasting blood coagulation disorder after an excessive blood coagulation process, and the size of the hematoma increased due to failure to carry out an appropriate blood coagulation process.
Based the above results, it can be considered that increases in the size of hematomas are correlated to changes in thrombogenesis or thrombolysis related factors in the case of sICH. However, this study failed to determine the quantitative values of each factor and its correlation with the increased volume of the hematoma. It is argued that the establishment of a system capable of predicting increases in the size of hematomas in patients with sICH by allocating scores to the values of each factor would have substantial clinical significance in the future.
Another limitation of this study is that the factors were tested once at the time of visiting the hospital. Therefore, the study did not analyze the association between the changes and increase in hematoma of sICH through follow-up tests.
The results of the two groups in this study may be biased owing to several factors: the location of hematomas; the degree of degenerative changes in blood vessels; the level of blood sugar control; the amount of hypertension treatment in the past; and the level of blood pressure control. However, another limitation of this study was that the above factors were not analyzed in detail.
Although the blood test was performed in the emergency ward while conducting this study, there were items for which it took about a day to obtain test results. Therefore, there is a need to improve the technique in order to acquire results of thrombogenesis or thrombolysis related factor tests for sICH patients in a shorter period of time.
CONCLUSION
The serum levels of thrombogenic or thrombolytic factors of patients with sICH at admission appear to be related to the risk of increase in the hematoma size, and would be helpful in the intensive care process, especially in the acute phase.